Archive
Archive
This is the archive page, containing previous versions of our infographic summaries and interactive data visualisations. You can find the current versions on our Infographics and Visualisations page.
The infographics are available as either Scalable Vector Graphics (SVG) or Adobe Acrobat Portable Document Format (PDF). The interactive data visualisations are on external websites. You can access both of them by selecting the relevant image. The data behind most visualisations is found in the Excel and Comma Separated Value (CSV) View Source table files. The most recent examples are at the top. The max file size is 9 MB.
Infographics
Scotland's Population 2018 - The Registrar General's Annual Review of Demographic Trends
Source Tables: (Excel CSV)
View Scotland's Population 2018 - The Registrar General's Annual Review of Demographic Trends publication
Vital Events Reference Tables 2018
Infographic
View Source Tables (Excel CSV)
View Vital Events Reference Tables 2018 publication
Estimates of Households and Dwellings in Scotland, 2018
Infographic
View Source Tables (Excel CSV)
View Estimates of Households and Dwellings in Scotland, 2018 publication
Babies' First Names 2018

View Source Tables (Excel CSV)
View Babies' First Names 2018 publication
Life expectancy for Scottish Areas, 2015-17

View Source Tables (Excel CSV)
View Life expectancy for Scottish Areas, 2015-17 publication
Life expectancy for Scotland, 2015-17

View Source Tables (Excel CSV)
View Life expectancy for Scotland, 2015-17 publication
Population estimates for small areas, Scotland, 2017

Source Tables: (Excel CSV)
View Population estimates for small areas, Scotland, 2017 publication
Scotland's Population 2017 - The Registrar General's Annual Review of Demographic Trends

Source Tables: (Excel CSV)
View Scotland's Population 2017 - The Registrar General's Annual Review of Demographic Trends publication
Estimates of Households and Dwellings in Scotland, 2017

View Source Tables (Excel CSV)
View Estimates of Households and Dwellings in Scotland, 2017 publication
Population by Country of Birth and Nationality, Scotland, 2017

View Source Tables (Excel CSV)
View Population by Country of Birth and Nationality, Scotland, 2017 publication
Population estimates, Scotland, 2017

View Source Tables (Excel CSV)
View Population estimates, Scotland, 2017 publication
Electoral Statistics, Scotland, 2017
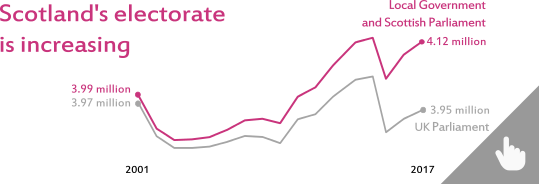
View source tables (Excel CSV)
View Electoral Statistics, Scotland, 2017 publication
Babies' First Names 2017
View Source Tables (Excel CSV)
View Babies' First Names 2017 publication
Life expectancy for Scottish Areas, 2014-16

View Source Tables (Excel CSV)
View Life expectancy for Scottish Areas, 2014-16 publication
Life expectancy for Scotland, 2014-16
View Source Tables (Excel CSV)
View Life expectancy for Scotland, 2014-16 publication
Populations Estimates for small areas, Scotland, 2016
View Source Tables (Excel CSV)
View Populations Estimates for small areas, Scotland, 2016 publication
Scotland's Population 2016 - The Registrar General's Annual Review of Demographic Trends (PDF)

The infographic booklet shows information from the Scotland’s Population – The Registrar General’s Annual Review 2016 publication. It includes Scottish demographic information on various topics including population, births, deaths, life expectancy, migration, marriages and civil partnership, adoption and households and housing in the year 2016.
View Source Tables (Excel CSV)
View Scotland's Population 2016 - The Registrar General's Annual Review of Demographic Trends publication
Estimates of Households and Dwellings in Scotland, 2016


The infographic shows information from the Estimates of households and dwellings in Scotland 2016 publication. It includes the overall change in households over time, comparison of the change in households and population over time, change in household size over time, comparison of how many homes are occupied, empty or second homes in 2016, and how household numbers have changed across Scotland’s council areas over the last ten years.
View Source Tables (Excel CSV)
View Estimates of Households and Dwellings in Scotland, 2016 publication
Infographic (PDF)
Mid-2016 population estimates Scotland (PDF)

The infographic shows information from the Mid-2016 population estimates Scotland publication. It includes the total population number and change over time, the impact of net migration and natural change on the population, the population by age and sex, detail on migration to and from Scotland and how the population has changed across Scotland’s council areas over the last year.
View source tables (Excel CSV)
View Mid-2016 population estimates Scotland publication
Babies' First Names 2016 (PDF) (Updated 14 March 2017)

The infographic shows information from the Babies' First Names publication. It includes a few examples of how the number of babies with a particular name has evolved over the years, covering examples from Scottish Islands.
View Source Tables (Excel CSV)
View Babies' First Names 2016 publication
Births and deaths Scotland 2016 (SVG)


The infographic shows information from the 2016 Births, Deaths and other Vital Events - Preliminary Annual Figures publication. It includes the total number of live births, births outside and inside of marriage/civil partnership, number of deaths, stillbirths and infant mortality rates and number of deaths by age group and gender.
View Source Tables (Excel CSV)
View Births and deaths Scotland 2016 publication
Infographic (PDF)
Marriages and civil partnerships Scotland 2016 (SVG)
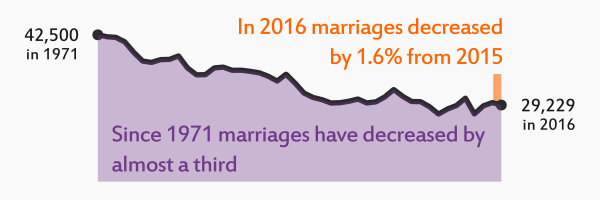

The infographic shows information from the 2016 Births, Deaths and other Vital Events - Preliminary Annual Figures publication. It includes total number of marriages, same-sex marriages, and civil partnerships over time.
View Source Tables (Excel CSV)
View Marriages and civil partnerships Scotland 2016 publication
Infographic (PDF)
Household projections for Scotland, 2014 to 2039 (SVG)


The infographic illustrates the results of the 2014-based Household Projections for Scotland publication. It includes information about how and why household numbers are changing.
View Source Tables (Excel CSV)
View Household projections for Scotland, 2014 to 2039 publication
Infographic (PDF)
Life Expectancy at birth within Scotland 2013-15 (SVG)


The infographic shows information from the Life Expectancy in Scottish Areas 2013-15 publication. It includes information about life expectancy at birth in Scotland for males and females, the gap between males and females, the variation across council areas and Scottish life expectancy compared to other European countries.
View Source Tables (Excel CSV)
View Life Expectancy at birth within Scotland 2013-15 publication
Infographic (PDF)
Scotland's Population 2015 - The Registrar General's Annual Review of Demographic Trends (PDF)

The infographic booklet shows information from the Scotland’s Population – The Registrar General’s Annual Review 2015 publication. It includes Scottish demographic information on various topics including population, births, deaths, life expectancy, migration, marriages and civil partnership, adoption and households and housing in the year 2015.
View Source Tables
View Scotland's Population 2015 - The Registrar General's Annual Review of Demographic Trends publication
Mid-2015 population estimates Scotland and corrected population estimates for mid-2012, mid-2013 and mid-2014 (PDF)

The infographic shows information from the Mid-2015 population estimates Scotland and corrected population estimates for mid-2012, mid-2013 and mid-2014 publication. It includes the total population number, the impact of net migration and natural change on the population, the estimated population by age and sex, and population change over time.
View source tables
View Mid-2015 population estimates Scotland and corrected population estimates for mid-2012, mid-2013 and mid-2014 publication
2015 Births, Deaths and Other Vital Events - Preliminary Annual Figures - Births and deaths Scotland, 2015 (SVG)


The infographic shows information from the 2015 Births, Deaths and other Vital Events - Preliminary Annual Figures publication. It includes the total number of live births, total number of stillbirths, births outside of marriage/civil partnership, number of deaths, infant mortality, and birth and death rates over time.
View Source Tables
View 2015 Births, Deaths and Other Vital Events - Preliminary Annual Figures - Births and deaths Scotland, 2015 publication
Infographic (PDF)
2015 Births, Deaths and Other Vital Events - Preliminary Annual Figures - Marriages and civil partnerships Scotland, 2015 (SVG)
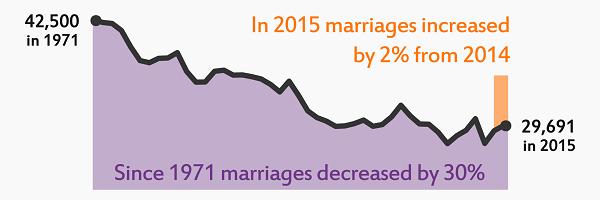

The infographic shows information from the 2015 Births, Deaths and other Vital Events - Preliminary Annual Figures publication. It includes total number of marriages, same-sex marriages, civil partnerships, and marriage and civil partnership rates over time.
View Source Tables
View 2015 Births, Deaths and Other Vital Events - Preliminary Annual Figures - Marriages and civil partnerships Scotland, 2015 publication
Infographic (PDF)
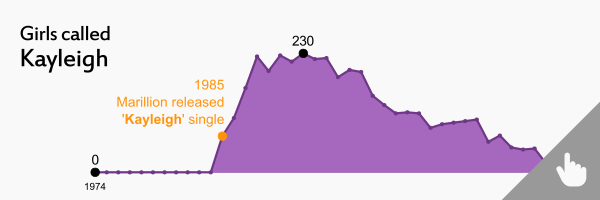
Babies' First Names 2015 (PDF) - Updated 15 March 2016

The infographic shows information from the Babies' First Names publication. It illustrates the number of different names and the average number of babies sharing each name between 1974 and 2015 for boys and girls. It also includes a few examples of how the number of babies with a particular name has evolved over the years, covering examples from popular culture.
View Source Table
View Babies' First Names 2015 publication
A data visualisation showing baby names trends in Scotland since 1974 is available below.
Projected Population of Scotland (2014-based) (SVG)


The infographic shows information from the Population projections for Scotland 2014-based publication. It includes the projected population estimates for 2024 and 2039, the impact of net migration and natural change on the projected population, the estimated population by age and sex for 2014 and 2039, and the projected population change by age group.
View Source Table
View Projected Population of Scotland (2014-based) publication
Infographic (PDF)
Scotland's Population 2014 - The Registrar General's Annual Review of Demographic Trends (PDF)
Correction 28 April 2016
We have recently become aware of error in the population pyramid on page 7 of this inforgraphics supplement. The data was incorrectly labelled for males and females and the data underlying the mid-2012 population was incorrect, this data was population at mid-2014. This infographic and the source data has now been corrected.
The infographic booklet shows information from the Scotland’s Population – The Registrar General’s Annual Review 2014 publication. It includes Scottish demographic information on various topics including population, births, deaths, life expectancy, migration, marriages and civil partnership, adoption and households and housing in the year 2014.
View Source Tables
View Scotland's Population 2014 - The Registrar General's Annual Review of Demographic Trends publication
Mid-year Population Estimates 2014 (SVG)


The infographic shows information from the Mid-year Population Estimates 2014 publication. It includes the total population number, the impact of net migration and natural change on the population, the estimated population by age and sex, and population change over time.
View Source Tables
View Mid-year Population Estimates 2014 publication
Infographic (PDF)
2014 Births, Deaths and Other Vital Events - Preliminary Annual Figures - Births and deaths Scotland, 2014 (SVG)
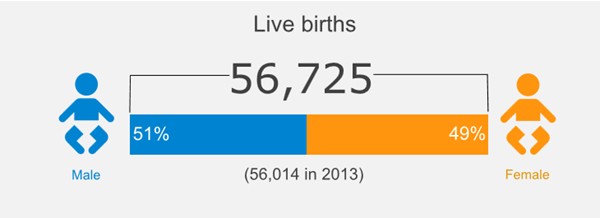

The infographic shows information from the 2014 Births, Deaths and other Vital Events - Preliminary Annual Figures publication. It includes the total number of live births, total number of stillbirths, births outside of marriage/civil partnership, number of deaths, infant mortality, and birth and death rates over time.
View Source Tables
View 2014 Births, Deaths and Other Vital Events - Preliminary Annual Figures - Births and deaths Scotland, 2014 publication
Infographic (PDF)
2014 Births, Deaths and Other Vital Events - Preliminary Annual Figures - Marriages and civil partnerships Scotland, 2014 (SVG)
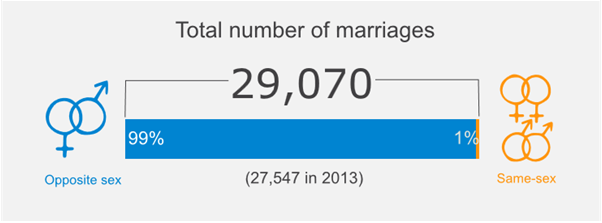
The infographic shows information from the 2014 Births, Deaths and other Vital Events - Preliminary Annual Figures publication. It includes total number of marriages, same-sex marriages, civil partnerships, and marriage and civil partnership rates over time.
View Source Tables
View 2014 Births, Deaths and Other Vital Events - Preliminary Annual Figures - Marriages and civil partnerships Scotland, 2014 publication
Infographic (PDF)
Interactive Data Visualisations
Mid-2017 population estimates Scotland

This visualisation shows the Mid-year Population Estimates for Scotland and its council areas from 1997 to 2017, the components of population change over the last year, a comparison of the age-sex structure of the population over the last 20 years, changes in the size of different age groups and percentage changes in population for council areas over the last 20 years.
View source tables (Excel CSV)
View Mid-2017 population estimates Scotland publication
Life expectancy for Scottish Areas, 2014-16
This interactive data visualisation shows information on Life Expectancy for Scottish Areas, 2014-16.
View Source Tables (Excel CSV)
View Life expectancy for Scottish Areas, 2014-16 publication
Cause of death, Scotland, 2002-2016

This interactive data visualisation shows information on cause of death in Scotland. Click and drag the bubbles around the screen to explore.
View Source Tables (Excel CSV)
View Cause of death, Scotland, 2002-2016 publication
Age-specific Birth rates, per 1,000 female population, Scotland, 1973 to 2016

This interactive data visualisation shows information about age-specific birth rates over time. Press play to observe the change in birth rates over time.
View Source Tables (Excel CSV)
View Age-specific Birth rates, per 1,000 female population, Scotland, 1973 to 2016 publication
Internal Migration in Scotland, year ending 30 June 2017
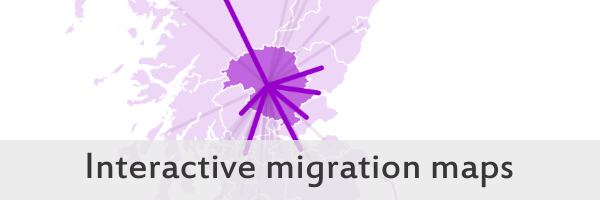
An interactive map showing the migration flows between council areas between mid-2016 and mid-2017.
Estimates of Households and Dwellings in Scotland, 2017

The visualisation shows the estimated number of households and average household size for Scotland and Scottish council areas from 2001 to 2016. You can use the charts to explore trends in your own council area.
View source tables (Excel CSV)
View Estimates of Households and Dwellings in Scotland, 2017 publication
Estimates of Households and Dwellings in Scotland, 2016
The visualisation shows the estimated number of households and average household size for Scotland and Scottish council areas from 2001 to 2016. You can use the charts to explore trends in your own council area.
View source tables (Excel CSV)
View Estimates of Households and Dwellings in Scotland, 2016 publication
Mid-2016 population estimates Scotland
This visualisation shows the Mid-year Population Estimates for Scotland and its council areas from 1996 to 2016, the components of population change over the last year, a comparison of the age-sex structure of the population over the last 20 years, changes in the size of different age groups and percentage changes in population for council areas over the last 20 years.
View source tables (Excel CSV)
View Mid-2016 population estimates Scotland publication
Household Projections for Scottish areas: 2014-based household projection variants

The number of households in Scotland is projected to increase by 14 per cent between 2014 and 2039, but this is not the expected trend in all areas of Scotland. What about your area? Select your council area on this interactive visualisation to explore the projected figures.
View Source Tables (Excel CSV)
View Household Projections for Scottish areas: 2014-based household projection variants publication
Population pyramids for Scottish areas: 2014-based population projections

What is the population in your area going to look like in the future? Compare the age and sex structure of your council area to other areas to see how different they are, and how different they might be in the future.
View Source Tables (Excel CSV)
View Population pyramids for Scottish areas: 2014-based population projections publication
Projections population for Scottish areas: 2014-based population projection variants

The population of Scotland is projected to increase by seven per cent between 2014 and 2039, but this is not the expected trend in all areas of Scotland. What about your area? Select your council area on this interactive visualisation to explore the projected population across the range of plausible future assumptions.
View Source Tables (Excel CSV)
View Projections population for Scottish areas: 2014-based population projection variants publication
Datashine Scotland interactive maps

Over 1,000 Quick/Key Statistics from Scotland’s Census 2011, mapped at output area and ward levels.
Data source
Population pyramids comparator tool

Enter your council area on this interactive visualisation to see Scotland’s Census 2011 data on population by age and sex, and how it has changed since 2001.
Data source
Census interactive tools
Explore this set of interactive maps and charts to see a range of interesting statistics from Scotland’s Census, presented in a way that is easy and accessible to use.
Data source
PDF files require Acrobat Reader. Download Acrobat Reader free 